greenBV4
Bench
- Messages
- 2,508
I've been posting these in the crowd watch thread but for the end of h/a and end of finals tables I thought I'd make it it's own thread
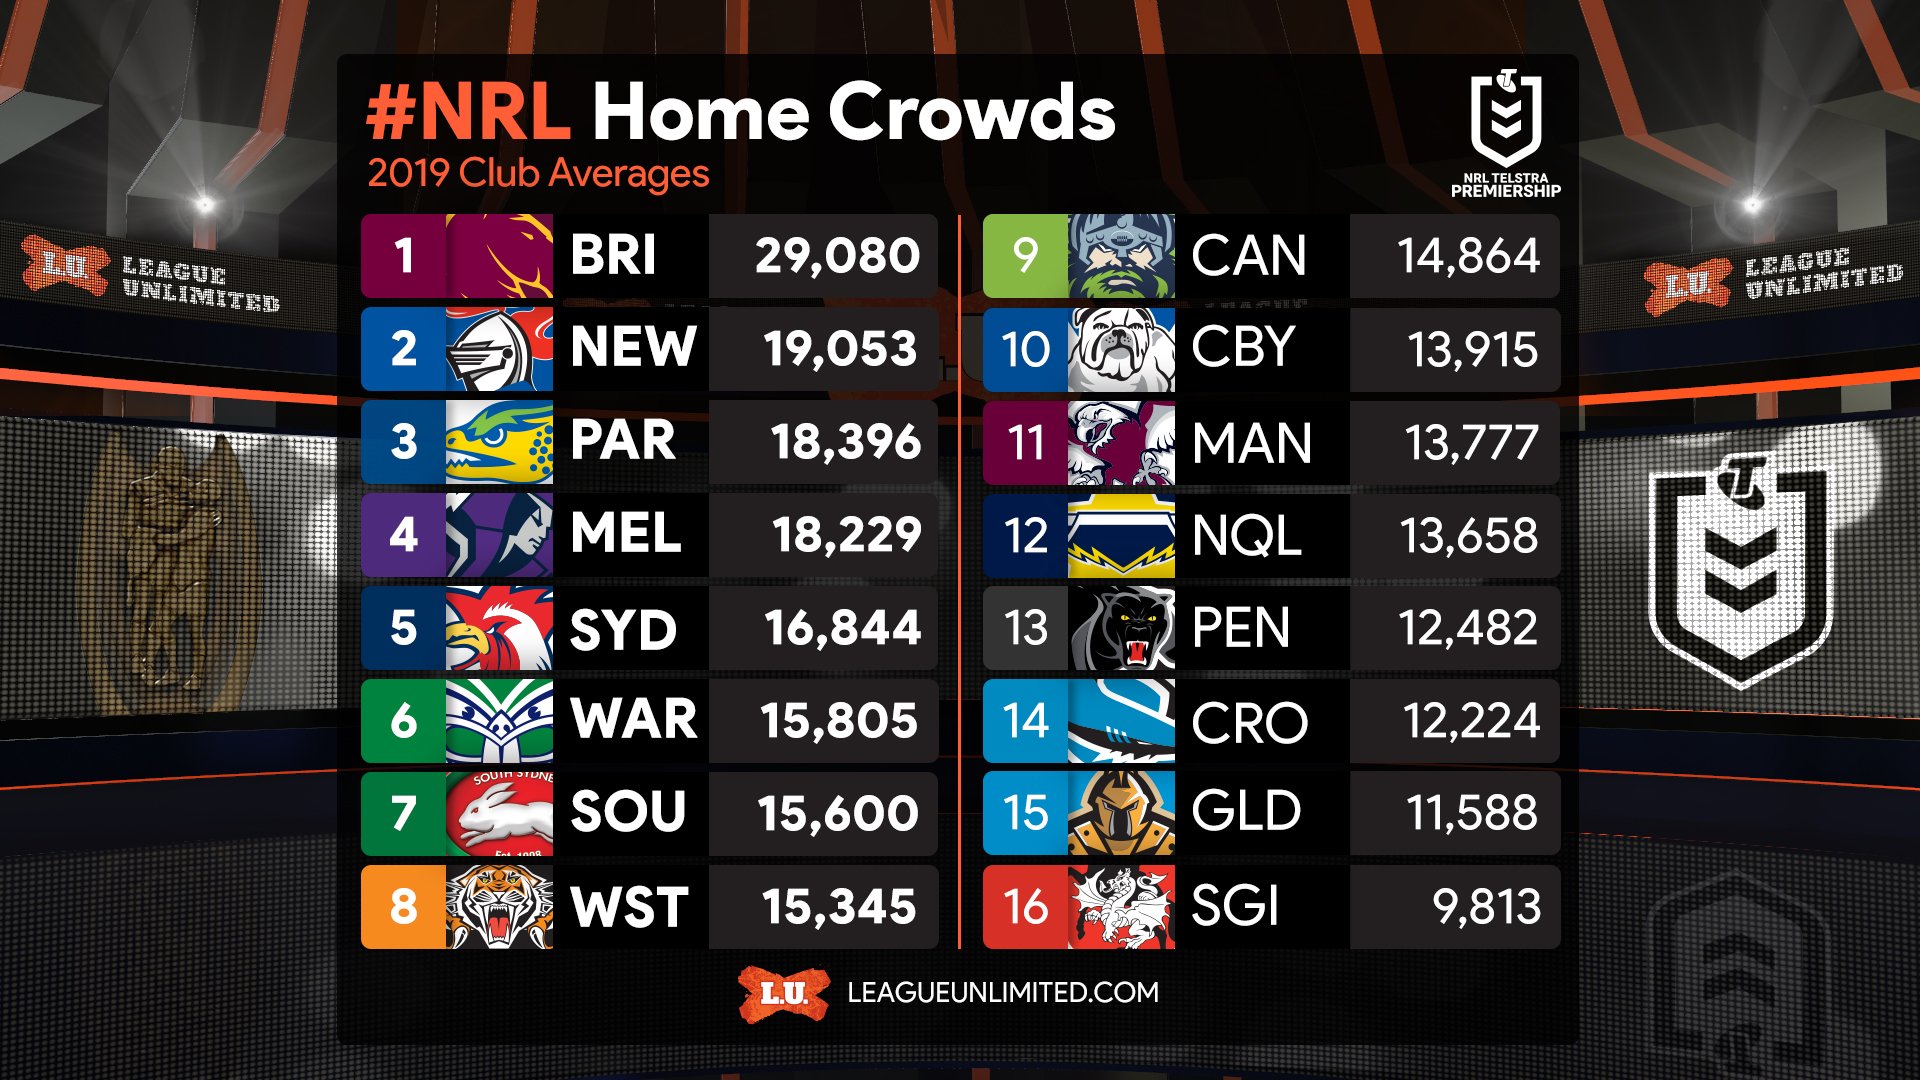
Heres the final averages and totals for the 2019 Home and Away Season:

7 venues increased there average from 2018, the largest being Belmore with a 54% improvement
14 venues had a average worse than last year, the worst drop being Kogarah with a 38% decrease
2 venues, Newcastle and Melbourne, broke even (after rounding to nearest whole number)
5 venues hosted their first NRL game and/or wasn't used last year
Brisbane dominated the top 10 crowds, as usual, with the only outlier being the SCG ANZAC game being the 4th largest
The bottom 10 was a mixed bag of mostly Sydney venues, with Darwin taking out the wooden spoon for crowds
The home/away season average is down 2% on last year, and on average all the venues had a 3% decrease.
If your confused by how any of these figures were calculated I'd be happy to explain the spreadsheet, also if you see anything wrong let me know so I can fix it
Heres the final averages and totals for the 2019 Home and Away Season:
7 venues increased there average from 2018, the largest being Belmore with a 54% improvement
14 venues had a average worse than last year, the worst drop being Kogarah with a 38% decrease
2 venues, Newcastle and Melbourne, broke even (after rounding to nearest whole number)
5 venues hosted their first NRL game and/or wasn't used last year
Brisbane dominated the top 10 crowds, as usual, with the only outlier being the SCG ANZAC game being the 4th largest
The bottom 10 was a mixed bag of mostly Sydney venues, with Darwin taking out the wooden spoon for crowds
The home/away season average is down 2% on last year, and on average all the venues had a 3% decrease.
If your confused by how any of these figures were calculated I'd be happy to explain the spreadsheet, also if you see anything wrong let me know so I can fix it