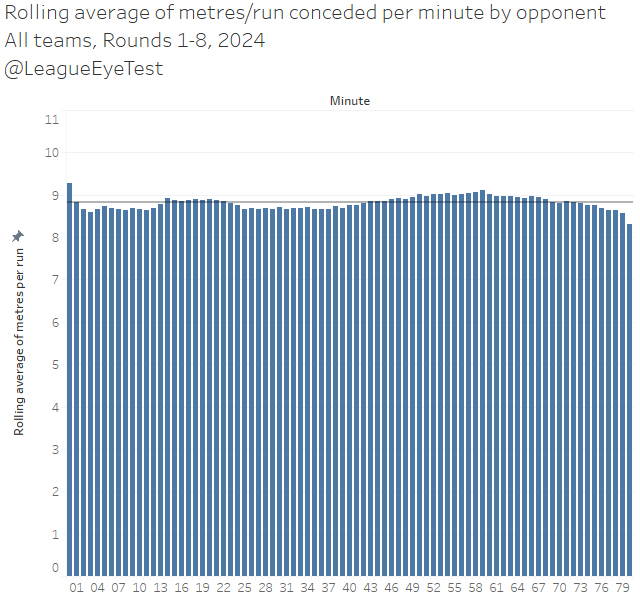
There’s very little difference across the course of a game in average metres per run. Generally, there are two small peaks, between 13-25 minutes as the first interchange of the half is made where metres per run increases, and again early in the second half where it rises above the league average. Towards the end of the game, it drops again as players tire and results are decided.
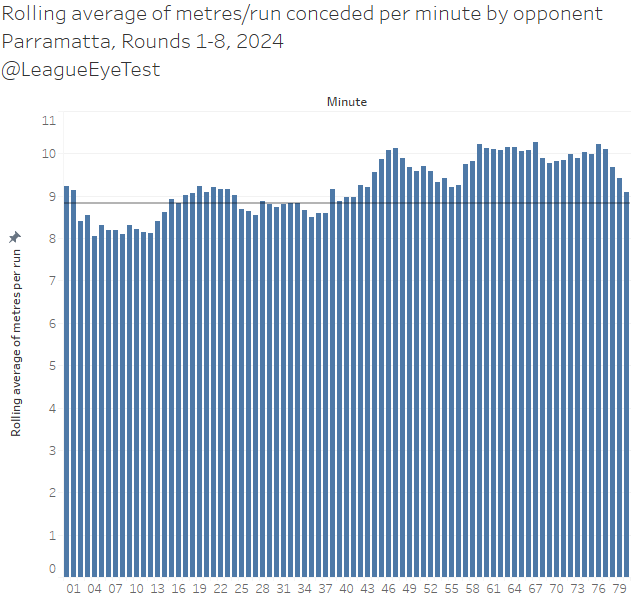
Now let’s check the same chart, with the same league average line, but for teams facing Parramatta.
Yikes. The Eels concede more metres per run for the majority of game, including basically every minute of the second half, including a big spike
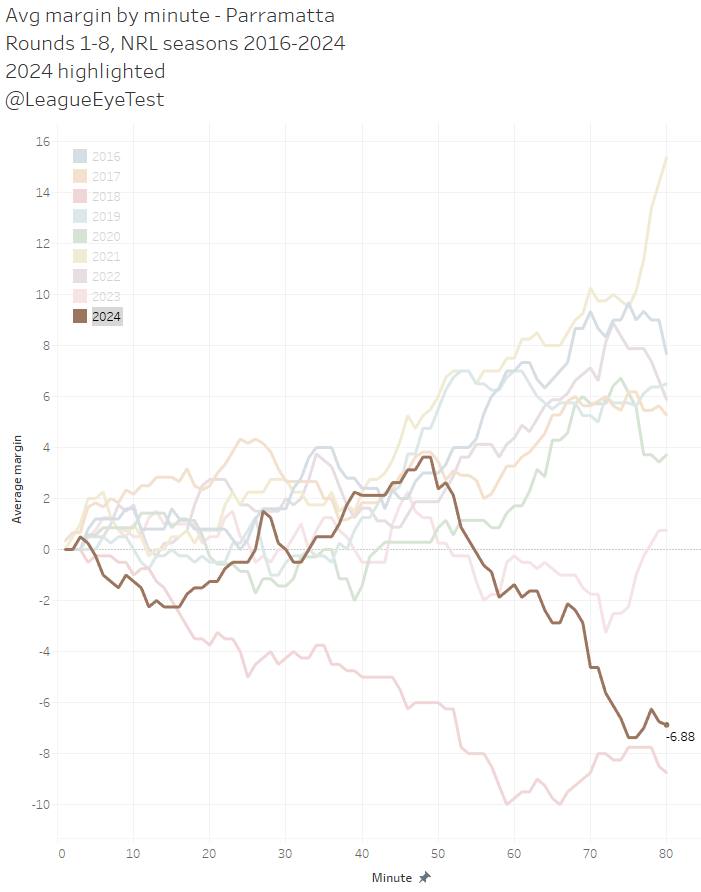
around the 46th minute, which we saw before was just before their margin starts to tank. It appears for some reason, just after the second half commences the Eels just cannot compete anymore.
It might be fitness related, or mental lapses, or players simply getting older, but whatever the case the effort levels aren’t there for the whole 80 minutes and they’re giving up extra metres at a time when other teams aren’t.
Speaking of metres per run, keen readers of last weeks breakdown of the Bulldogs and Cowboys would have noted how poorly the Eels were faring running the ball and also containing their opponents yardage. Here’s an update of those charts from last week, starting with metres per run by team for 2024.
Dreadful stuff here, as the Eels are averaging just 8.07 metres per carry this season, dead last in the competition. That’s nearly 1 metre per run below the Broncos and Warriors.
One of the reasons this number is so bad is that the Eels do not have a regular forward whose metres/run average sits above the 63rd percentile. That’s Junior Paulo, and the next best is Joe Ofahengaue at the 50th percentile. Luca Moretti does rank in the 80th percentile but is playing less than 20 minutes a game and still has to improve other parts of his game.
There’s no damaging ball runner off the bench, there’s no strike back rower to eat up metres on an edge. Just a group of aging forwards who don’t generate the metres they used to.
Similarly, only a handful of Eels players are gaining more than their
expected metres. Of regular players only Will Penisini and Bailey Simonsson run for more metres than an average player would in the same situation (field position and tackle number), and Moretti, Kelma Tuilagi and Blayze Talagi are the only others in the positives from a low sample size. Again, there’s no regular go forward from their starting pack.
And if you want an idea of how offloads are an irrelevant stat in a vacuum, the Eels lead the NRL in them with 102 this season, 15 more than second placed (the Roosters) and 20 more than third place (Wests Tigers). Second phase play is only useful when it generates more yardage, and Parramatta do it worse than anyone this season.
Flipping that last chart around, let’s now look at metres per carry conceded.
Another disaster for Parra here, allowing 8.98 metres per run, only in second place by 1 centimetre to St George Illawarra and only 2 centimetres ahead of South Sydney. You can point to Brisbane being not much better at allowing 8.82 metres per run, but they’ve proven over the last 18 months to have some excellent goal line defense which allows them to take more risks. Parramatta has no such luxury.
And when you combine this into net metres per run (gained minus conceded), it’s even more telling.
The blue and gold are allowing a cold as ice 0.909 metres per run more than they’re gaining this season, which is atrocious. With nearly an extra one metre per carry, that adds up to almost 5 extra metres per set allowed.
Compounded over 35-40 opponent sets a game, these numbers add up. Additionally, that net metres per run number jumps up again to -1.1 net metres per run if you limit it to second halves only, again worst in the NRL.
It’s also the sixth worst team net metres per run mark in a decade after eight rounds, up there with the 2017 Knights and Titans, and the 2021 Bulldogs.
The teams above them finished last, last, 14th, 15th and last if you want an idea of how the Eels are traveling here.
If we breakdown metres per run allowed into pre and post contact metre components, you can see how much of this stems from a line speed issue.

 www.rugbyleagueeyetest.com
