What's new
The Front Row Forums

Register a free account today to become a member of the world's largest Rugby League discussion forum! Once signed in, you'll be able to participate on this site by adding your own topics and posts, as well as connect with other members through your own private inbox!

What is the best way to count Premierships??

DiegoNT

First Grade
Messages
9,378
How about this for a points system

10 points for a FG title / Club Championship
9 points for WCC / Australia Championship FG title
8 points for a pre season / midweek / post season title / Minor Premiership
7 points for a 7s or 9s title
6 points for a 2G / RG / NSW Cup / QLD Cup title / Tier 2 Aus Championship
5 points for 3G title (or U23s U21s or U20s)
4 points for U21s title
3 points for U19s title
2 points for U17 or U18s title
1 point for U15s or U16s title
So which team comes out on top of that
 

siv

First Grade
Messages
6,771
Let the numbers crunchers have fun

But in almost every number crunch the team with the most FG RG or the most U21s title will still probably be on top

The only other method is a % of premierships obtained v number of the years a team competed
 

alien

Referee
Messages
20,279
Do you have any teams on 21 or above?

If so, let them in the NRL. The meltdown from souffs fans about a club claiming equal or more than them will be glorious.

they wouldn't be recognized as nrl premierships.
 

alien

Referee
Messages
20,279
This is the problem i have with the current tallies...

If we're going to count NSWRL from 1908, we should be counting NSW cup Premierships today aswell...

no because the nrl first grade comp we have today came from the nswrl first grade comp

nsw cup premierships are basically 2nd grade/reserve grade premierships
 

alien

Referee
Messages
20,279
In 2010, PAFC & PAMFC merged so now the club effectively has teams playing in two competitions as one club - PAFC. The SANFL team is basically it's reserves team in the state league now, but the club doesn't have any junior teams anymore. As you say, the club is considered to have won 1 AFL premiership, and 36 SANFL premierships.

and the 36 sanfl premierships are only 2nd tier premierships
 

alien

Referee
Messages
20,279
Let the numbers crunchers have fun

But in almost every number crunch the team with the most FG RG or the most U21s title will still probably be on top

The only other method is a % of premierships obtained v number of the years a team competed

you guys can say whatever you like. the nrl only goes by total nrl premierships, and that's how it should be

upload_2016-7-30_2-11-3.png
 

juro

Bench
Messages
3,826
Let the numbers crunchers have fun

But in almost every number crunch the team with the most FG RG or the most U21s title will still probably be on top

The only other method is a % of premierships obtained v number of the years a team competed
This approach has a lot of validility to it. When you compare the Storm and Newtown, both have won 3 premierships. However, the Storm have only existed for 21 seasons, in which there were 14-20 teams competing. Newtown competed for 76 seasons, in which 8-14 teams competed. Melbourne have clearly outperformed most other clubs over their history, while Newtown underperformed.

If we were to assume that each team has an equal likelihood to all other teams of winning a premiership, we can work out how many premierships each team would be expected to have won over its complete history. The ratio of the actual premierships to expected premierships gives how effective each team has been.

The ratings for existing clubs on this basis are:
1. Broncos: 3.04 (6/1.97)
2. Storm: 2.25 (3/1.34)
3. Rabbitohs: 2.06 (21/10.19)
4. Sea Eagles:1.47 (8/5.45)
5. Roosters: 1.35 (14/10.34)
6. Raiders: 1.24 (3/2.42)
7. Bulldogs: 1.12 (8/7.13)
8. Knights: 1.02 (2/1.96)
9. Tigers: 0.82 (1/1.23)
10. Dragons: 0.78 (1/1.29)
11. Eels: 0.71 (4/5.66)
12. Cowboys: 0.65 (1/1.54)
13. Panthers: 0.54 (2/3.67)
14. Sharks: 0.27 (1/3.67)
15. Titans: 0.00 (0/0.75)
16. Warriors: 0.00 (0/1.54)

We can also rate teams against those that no longer exist. These are:
1. St George: 2.01 (15/7.45)
2. Balmain: 1.21 (11/9.11)
3. Magpies: 0.44 (4/9.11)
4. Newtown: 0.37 (3/8.07)
5. Norths: 0.22 (2/9.11)
6. Hunter: 0.00 (0/0.10)
7. Cumberland: 0.00 (0/0.11)
8. Adelaide: 0.00 (0/0.15)
9. Sth Queensland: 0.00 (0/0.18)
10. Perth: 0.00 (0/0.20)
11. Northern Eagles: 0.00 (0/0.21)
12. Newcastle (1908): 0.00 (0/0.24)
13. Gold Coast Seagulls: 0.00 (0/0.67)
14. Illawarra: 0.00 (0/1.12)
15. Annandale: 0.00 (0/1.36)
16. University: 0.00 (0/2.07)
17. Glebe: 0.00 (0/2.60)

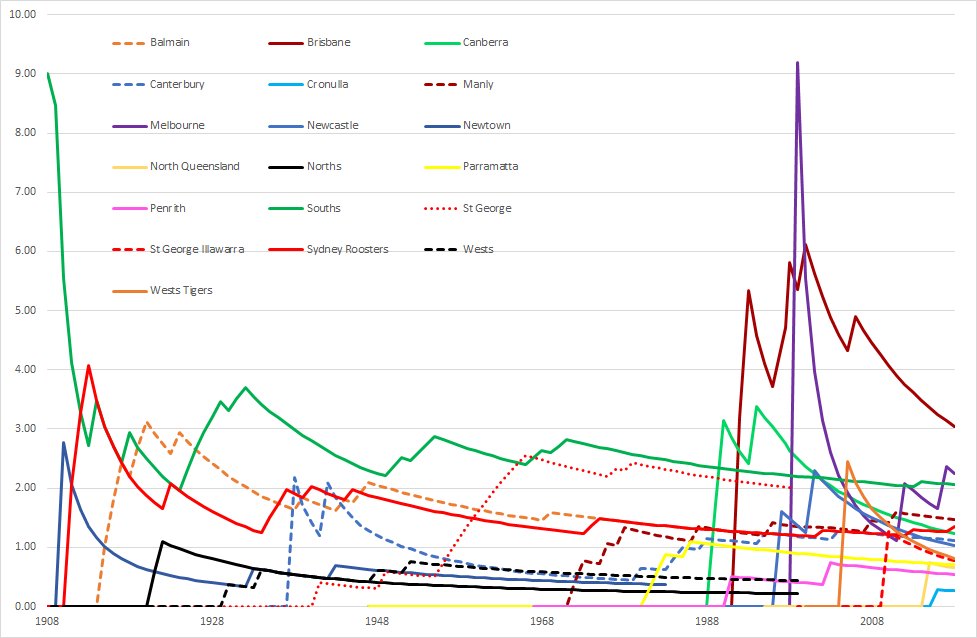
Looking at it graphically, you can see the spikes when teams win a premiership. The earlier in the club's history, the higher the spike. Melbourne winning in their second year had a much bigger boost than the Sharks winning in their 50th year.
DojidpNUYAAQ1Iz.jpg:large


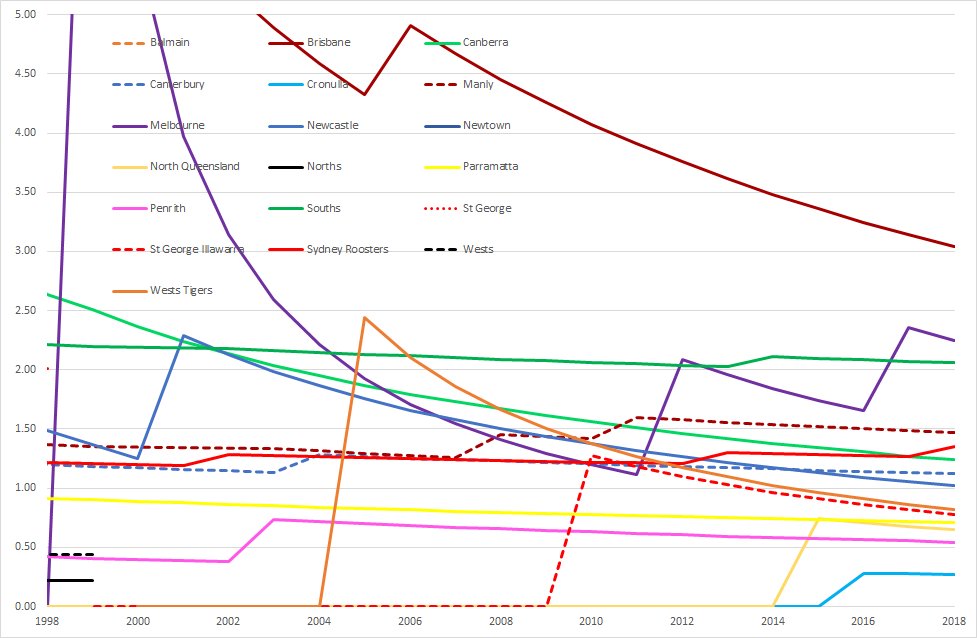
And zooming in on the last 20 years, we can see that the Roosters have moved in front of the Raiders again.
DojiyISU4AAh89U.jpg:large


Over the years, the following clubs have been on top:
1908-1912: Rabbitohs
1913: Roosters
1914-1917: Rabbitohs, Roosters
1918: Rabbitohs
1919: Balmain, Rabbitohs
1920-1925: Balmain
1926: Balmain, Rabbitohs
1927-1965: Rabbitohs
1966-1967: St George
1968-1989: Rabbitohs
1990-1991: Raiders
1992-1998: Broncos
1999: Storm
2000-2018: Broncos
 

mozza91

Coach
Messages
14,329
ARL Premierships won in 1997 and NRL Premierships won in 2001 should be the only ones that count imo.
 

Fire

First Grade
Messages
9,669
This approach has a lot of validility to it. When you compare the Storm and Newtown, both have won 3 premierships. However, the Storm have only existed for 21 seasons, in which there were 14-20 teams competing. Newtown competed for 76 seasons, in which 8-14 teams competed. Melbourne have clearly outperformed most other clubs over their history, while Newtown underperformed.

If we were to assume that each team has an equal likelihood to all other teams of winning a premiership, we can work out how many premierships each team would be expected to have won over its complete history. The ratio of the actual premierships to expected premierships gives how effective each team has been.

The ratings for existing clubs on this basis are:
1. Broncos: 3.04 (6/1.97)
2. Storm: 2.25 (3/1.34)
3. Rabbitohs: 2.06 (21/10.19)
4. Sea Eagles:1.47 (8/5.45)
5. Roosters: 1.35 (14/10.34)
6. Raiders: 1.24 (3/2.42)
7. Bulldogs: 1.12 (8/7.13)
8. Knights: 1.02 (2/1.96)
9. Tigers: 0.82 (1/1.23)
10. Dragons: 0.78 (1/1.29)
11. Eels: 0.71 (4/5.66)
12. Cowboys: 0.65 (1/1.54)
13. Panthers: 0.54 (2/3.67)
14. Sharks: 0.27 (1/3.67)
15. Titans: 0.00 (0/0.75)
16. Warriors: 0.00 (0/1.54)

We can also rate teams against those that no longer exist. These are:
1. St George: 2.01 (15/7.45)
2. Balmain: 1.21 (11/9.11)
3. Magpies: 0.44 (4/9.11)
4. Newtown: 0.37 (3/8.07)
5. Norths: 0.22 (2/9.11)
6. Hunter: 0.00 (0/0.10)
7. Cumberland: 0.00 (0/0.11)
8. Adelaide: 0.00 (0/0.15)
9. Sth Queensland: 0.00 (0/0.18)
10. Perth: 0.00 (0/0.20)
11. Northern Eagles: 0.00 (0/0.21)
12. Newcastle (1908): 0.00 (0/0.24)
13. Gold Coast Seagulls: 0.00 (0/0.67)
14. Illawarra: 0.00 (0/1.12)
15. Annandale: 0.00 (0/1.36)
16. University: 0.00 (0/2.07)
17. Glebe: 0.00 (0/2.60)

Looking at it graphically, you can see the spikes when teams win a premiership. The earlier in the club's history, the higher the spike. Melbourne winning in their second year had a much bigger boost than the Sharks winning in their 50th year.
DojidpNUYAAQ1Iz.jpg:large


And zooming in on the last 20 years, we can see that the Roosters have moved in front of the Raiders again.
DojiyISU4AAh89U.jpg:large


Over the years, the following clubs have been on top:
1908-1912: Rabbitohs
1913: Roosters
1914-1917: Rabbitohs, Roosters
1918: Rabbitohs
1919: Balmain, Rabbitohs
1920-1925: Balmain
1926: Balmain, Rabbitohs
1927-1965: Rabbitohs
1966-1967: St George
1968-1989: Rabbitohs
1990-1991: Raiders
1992-1998: Broncos
1999: Storm
2000-2018: Broncos
Nice work mate, cheers.
 

veggiepatch1959

First Grade
Messages
9,841
This approach has a lot of validility to it. When you compare the Storm and Newtown, both have won 3 premierships. However, the Storm have only existed for 21 seasons, in which there were 14-20 teams competing. Newtown competed for 76 seasons, in which 8-14 teams competed. Melbourne have clearly outperformed most other clubs over their history, while Newtown underperformed.

If we were to assume that each team has an equal likelihood to all other teams of winning a premiership, we can work out how many premierships each team would be expected to have won over its complete history. The ratio of the actual premierships to expected premierships gives how effective each team has been.

The ratings for existing clubs on this basis are:
1. Broncos: 3.04 (6/1.97)
2. Storm: 2.25 (3/1.34)
3. Rabbitohs: 2.06 (21/10.19)
4. Sea Eagles:1.47 (8/5.45)
5. Roosters: 1.35 (14/10.34)
6. Raiders: 1.24 (3/2.42)
7. Bulldogs: 1.12 (8/7.13)
8. Knights: 1.02 (2/1.96)
9. Tigers: 0.82 (1/1.23)
10. Dragons: 0.78 (1/1.29)
11. Eels: 0.71 (4/5.66)
12. Cowboys: 0.65 (1/1.54)
13. Panthers: 0.54 (2/3.67)
14. Sharks: 0.27 (1/3.67)
15. Titans: 0.00 (0/0.75)
16. Warriors: 0.00 (0/1.54)

We can also rate teams against those that no longer exist. These are:
1. St George: 2.01 (15/7.45)
2. Balmain: 1.21 (11/9.11)
3. Magpies: 0.44 (4/9.11)
4. Newtown: 0.37 (3/8.07)
5. Norths: 0.22 (2/9.11)
6. Hunter: 0.00 (0/0.10)
7. Cumberland: 0.00 (0/0.11)
8. Adelaide: 0.00 (0/0.15)
9. Sth Queensland: 0.00 (0/0.18)
10. Perth: 0.00 (0/0.20)
11. Northern Eagles: 0.00 (0/0.21)
12. Newcastle (1908): 0.00 (0/0.24)
13. Gold Coast Seagulls: 0.00 (0/0.67)
14. Illawarra: 0.00 (0/1.12)
15. Annandale: 0.00 (0/1.36)
16. University: 0.00 (0/2.07)
17. Glebe: 0.00 (0/2.60)

Looking at it graphically, you can see the spikes when teams win a premiership. The earlier in the club's history, the higher the spike. Melbourne winning in their second year had a much bigger boost than the Sharks winning in their 50th year.
DojidpNUYAAQ1Iz.jpg:large


And zooming in on the last 20 years, we can see that the Roosters have moved in front of the Raiders again.
DojiyISU4AAh89U.jpg:large


Over the years, the following clubs have been on top:
1908-1912: Rabbitohs
1913: Roosters
1914-1917: Rabbitohs, Roosters
1918: Rabbitohs
1919: Balmain, Rabbitohs
1920-1925: Balmain
1926: Balmain, Rabbitohs
1927-1965: Rabbitohs
1966-1967: St George
1968-1989: Rabbitohs
1990-1991: Raiders
1992-1998: Broncos
1999: Storm
2000-2018: Broncos
Thank you resident LU statistician.
 

isaiah

Bench
Messages
4,969
I'd be much more inclined to use state rep games as a measure of the 2 comps. NSW used to spank QLD every year, leading to the creation of state of origin to make it less one sided.

Then you could also use the number of national reps from each comp, which the NSWRL dominated as well
'To make it less one sided' should read, to show a fairer comparison of strength. Apart from Inglis, when did a nsw player play against his own state?
 

Hutty1986

Immortal
Messages
34,034
Roosters and storm are acknowledged as the most dominant this decade but roosters have three since 1975 and Melb still two. Criteria for dominance must be getting to a gf or one game short of it
Manly would be up there too
 

Danish

Referee
Messages
32,019
'To make it less one sided' should read, to show a fairer comparison of strength. Apart from Inglis, when did a nsw player play against his own state?


Pre-state of origin? I would assume never, since the NSWRL was obviously the best league in the country and thus attracted all many a Queensland player to come down and try and make it in the big leagues.

The only reason a player from NSW would find themselves in the Queensland cup back then was because they’d failed to cut it in Sydney
 

9701

First Grade
Messages
5,400
For newcastle fans I find using the thumb and the index finger as a guide to our tally helps
 

big hit!

Bench
Messages
3,452
This competition began in 1908. Abe Lincoln isn't any less of a president just because he was elected when women and black people couldn't vote.

You can only beat who you have infront of you. And besides, the professionalism of the Sydney comp was so far ahead of the Brisbane comp none of the Brisbane clubs would have been a factor if they were part of a national comp.

Every premiership counts and it is offensive to the men who planted the seeds that led to this incredibly successful league if you try and piss on most of the history.

rugby league and professionalism are mutually exclusive I'm sorry to say
 

Latest posts

Top