What's new
The Front Row Forums

Register a free account today to become a member of the world's largest Rugby League discussion forum! Once signed in, you'll be able to participate on this site by adding your own topics and posts, as well as connect with other members through your own private inbox!

WA BEARS

Perth Red

Post Whore
Messages
69,549
Ch9 don't seem to care too much for RL. They give us $115m pa for three games a week then four games during the last five rounds, yet wanted to give AwFuL $500m pa for everything.
Worse than that they actually paid around $90mill cash for 3 games a week. The $115mill cash includes origin and radio rights.

Compare that to the estimated $175/195mill ch7 are paying afl for 4 games. And the zero $’s they’ve paid for expansion.

Yep you are right the sooner we bin ch9 the better for the game. I hope ch10/paramount blow them and fox out the water for 2028 rights!
 
Messages
14,822
Worse than that they actually paid around $90mill cash for 3 games a week. The $115mill cash includes origin and radio rights.

Compare that to the estimated $175/195mill ch7 are paying afl for 4 games. And the zero $’s they’ve paid for expansion.

Yep you are right the sooner we bin ch9 the better for the game. I hope ch10/paramount blow them and fox out the water for 2028 rights!
They'll never reveal how many are actually watching the games on Nine Now and Kayo. It wouldn't surprise me if AwFuL get better ratings. They draw great attendances all around the country.
 

Pippen94

First Grade
Messages
7,123
I can’t be arsed to go through every round but I know it fluctuates between 4k and 15k quite a lot.

yes it is a fact. And with such low sample size and low extrapolitaion the reliability and validity of the methodology is dodgy as. Can you explain to me how they get 4000 viewers? With one box per 3000 people were 1.3 people watching the game??

I’m saying that if 120k are tuning in on fta for rl event games it’s an indication that theres a sht load more than 6k fans here lol

Which is totally irrelevant and I’m not sure why you e mentioned it? I’m not saying how many will turn up every week, theres a shed load of variable factors in that, but it is indication of size of active rl fanbase here.

community rugby league in all its formats was over 30k participants last year

thats your opinion, not fact. I’d suggest, as I was at the games and saw how much merch was on show from SL and NRL, that it was largely RL fans attending Them.

Ha - you inflated participation by over 7000%. Clown
 

Colk

First Grade
Messages
6,750
Worse than that they actually paid around $90mill cash for 3 games a week. The $115mill cash includes origin and radio rights.

Compare that to the estimated $175/195mill ch7 are paying afl for 4 games. And the zero $’s they’ve paid for expansion.

Yep you are right the sooner we bin ch9 the better for the game. I hope ch10/paramount blow them and fox out the water for 2028 rights!

That’s our only hope I feel.
 

The_Wookie

Bench
Messages
3,248
I can’t be arsed to go through every round but I know it fluctuates between 4k and 15k quite a lot.

I can, I have and it does, but the average is still 8k. thats a fact.

yes it is a fact. And with such low sample size and low extrapolitaion the reliability and validity of the methodology is dodgy as.

Sampling is recognised as a legitimate way to obtain data. its also the standard used by the broadcasting and sports industry for decades here and in every country where they have ratings agencies.

I’m saying that if 120k are tuning in on fta for rl event games it’s an indication that theres a sht load more than 6k fans here lol

Im saying that a lot of those tuning in are tuning in for Origin and the Grand Final, not necessarily for rugby league. It is a huge mistake to believe that these are actual fans of the game.

Which is totally irrelevant and I’m not sure why you e mentioned it? I’m not saying how many will turn up every week, theres a shed load of variable factors in that, but it is indication of size of active rl fanbase here.

My mistake, I thought you were trying to justify starting an NRL team to play over in Perth or something.

community rugby league in all its formats was over 30k participants last year

Participation numbers are rubbery as hell. If I trotted AFL participation in all formats out in oh lets say NZ. and claimed there were tens of thousands of participants when there was just a fraction of that in actual players, Id be rightfully laughed out of these forums.

thats your opinion, not fact. I’d suggest, as I was at the games and saw how much merch was on show from SL and NRL, that it was largely RL fans attending Them.
thats your opinion too mate.
 

The_Wookie

Bench
Messages
3,248
They'll never reveal how many are actually watching the games on Nine Now and Kayo. It wouldn't surprise me if AwFuL get better ratings. They draw great attendances all around the country.

Nine Now data is publicly available every week, as well as consolidated in total tv data (averaging 32k per match) - its worth noting that this is not done via set top box, Oztam using a different methodology for it. We do get some limited reporting - generally early in season - on kayo numbers (which is where i and others use it to conservatively estimate it for the rest of the season).
 
Last edited:

The_Wookie

Bench
Messages
3,248
I can’t be arsed to go through every round but I know it fluctuates between 4k and 15k quite a lot.

as I said, I can, have and its 8k. (7,958) in season.

RoundHomeAway9 Perth
1BrisbaneSouth Sydney7,000
1PenrithManly6,000
1ParramattaGold Coast4,000
2SydneyManly7,000
2MelbourneSouth Sydney4,000
2NewcastleWests Tigers3,000
3St GeorgeCronulla8,000
3South SydneySydney8,000
3BrisbaneNorth Queensland6,000
4PenrithSouth Sydney12,000
4MelbourneCanterbury11,000
4Gold CoastWests Tigers6,000
5NewcastleManlyn/a
5CronullaWests Tigers8,000
5BrisbaneSydney6,000
6CanberraNorth Queenslandn/a
6South SydneyCanterbury9,000
6St GeorgeNewcastle9,000
6PenrithBrisbane7,000
7CronullaManly10,000
7BrisbaneCanterbury9,000
7St GeorgeSydney9,000
7PenrithCanberra7,000
8BrisbneCronulla11,000
8South SydneyManly9,000
8St GeorgeWests Tigers8,000
9South SydneyBrisbane10,000
9PenrithParramatta9,000
9CronullaNew Zealand8,000
10MelbournePenrith11,000
10ManlyBrisbane10,000
10SydneyParramatta10,000
11NewcastleBrisbane12,000
11ParramattaManly5,000
11Gold CoastCronulla4,000
12MelbourneManly11,000
12BrisbaneGold Coast6,000
12CanberraParramatta6,000
13Gold CoastNorth Queenslandn/a
13PenrithCanteberbury7,000
13CanberraSydney6,000
14North QueenslandSt George10,000
14NewcastlePenrith7,000
15CanterburyWests Tigers10,000
15MelbourneBrisbane9,000
15St GeorgeSouth Sydney6,000
16ManlyMelbourne8,000
16PenrithSydney6,000
16St George IllawarraCanberra4,000
17CronullaMelbournen/a
17BrisbaneSt George15,000
17NewcastleSouth Sydney6,000
18MelbourneCanberra7,000
18ParramattaNew Zealand6,000
19NewcastleSydneyn/a
19ParramattaBrisbane12,000
19CanterburyGold Coast10,000
20ManlySydney13,000
20ParramattaPenrith12,000
20NewcastleCanterbury11,000
21CronullaSt Georgen/a
21Wests TigersNewcastlen/a
21SydneyBrisbane10,000
21ManlyParramatta9,000
22Gold CoastManlyn/a
22PenrithMelbourne14,000
22ParramatttaSouth Sydney9,000
22BrisbaneNewcastle4,000
23South SydneyPenrith7,000
23BrisbaneMelbourne7,000
23NewcastleCanberra6,000
23SydneyWests Tigers4,000
24MelbourneSydney9,000
24BrisbaneParramatta8,000
24South SydneyNorth Queensland7,000
24Gold CoastNewcastle5,000
25ParramattaMelbourne11,000
25Wests TigersCanberra6,000
25SydneySouth Sydney3,000
25North QueenslandPenrith3,000
 

The_Wookie

Bench
Messages
3,248
National BVOD (9NOW) ratings

RoundHomeAway9NOW Cons 7
1PenrithManly53,000
1BrisbaneSouth Sydney42,000
1ParramattaGold Coast22,000
2MelbourneSouth Sydney44,000
2SydneyManly33,000
2NewcastleWests Tigers19,000
3South SydneySydney40,000
3St GeorgeCronulla32,000
3BrisbaneNorth Queensland25,000
4PenrithSouth Sydney42,000
4Gold CoastWests Tigers33,000
4MelbourneCanterbury24,000
5BrisbaneSydney37,000
5NewcastleManly35,000
5CronullaWests Tigers21,000
6PenrithBrisbane34,000
6CanberraNorth Queensland27,000
6South SydneyCanterbury19,000
6St GeorgeNewcastle18,000
7BrisbaneCanterbury41,000
7CronullaManly33,000
7St GeorgeSydney29,000
7PenrithCanberra21,000
8BrisbneCronulla42,000
8South SydneyManly32,000
8St GeorgeWests Tigers21,000
9South SydneyBrisbane44,000
9PenrithParramatta44,000
9CronullaNew Zealand21,000
10ManlyBrisbane39,000
10MelbournePenrith33,000
10SydneyParramatta26,000
11NewcastleBrisbane40,000
11ParramattaManly34,000
11Gold CoastCronulla21,000
12MelbourneManly37,000
12BrisbaneGold Coast37,000
12CanberraParramatta24,000
13PenrithCanteberbury34,000
13Gold CoastNorth Queensland31,000
13CanberraSydney23,000
14North QueenslandSt George33,000
14NewcastlePenrith21,000
15MelbourneBrisbane40,000
15St GeorgeSouth Sydney34,000
15CanterburyWests Tigers23,000
16PenrithSydney38,000
16ManlyMelbourne35,000
16St George IllawarraCanberra23,000
17NewcastleSouth Sydney35,000
17CronullaMelbourne33,000
17BrisbaneSt George29,000
18ParramattaNew Zealand29,000
18MelbourneCanberra25,000
19ParramattaBrisbane49,000
19NewcastleSydney29,000
19CanterburyGold Coast24,000
20ManlySydney43,000
20ParramattaPenrith42,000
20NewcastleCanterbury23,000
21SydneyBrisbane42,000
21ManlyParramatta37,000
21Wests TigersNewcastle20,000
21CronullaSt George19,000
22PenrithMelbourne51,000
22ParramatttaSouth Sydney41,000
22BrisbaneNewcastle25,000
22Gold CoastManly21,000
23South SydneyPenrith54,000
23BrisbaneMelbourne42,000
23NewcastleCanberra22,000
23SydneyWests Tigers19,000
24BrisbaneParramatta50,000
24MelbourneSydney50,000
24South SydneyNorth Queensland30,000
24Gold CoastNewcastle20,000
25ParramattaMelbourne57,000
25SydneySouth Sydney54,000
25North QueenslandPenrith26,000
25Wests TigersCanberra22,000
 

Perth Red

Post Whore
Messages
69,549
I can, I have and it does, but the average is still 8k. thats a fact.


Sampling is recognised as a legitimate way to obtain data. its also the standard used by the broadcasting and sports industry for decades here and in every country where they have ratings agencies.


Im saying that a lot of those tuning in are tuning in for Origin and the Grand Final, not necessarily for rugby league. It is a huge mistake to believe that these are actual fans of the game.


My mistake, I thought you were trying to justify starting an NRL team to play over in Perth or something.


Participation numbers are rubbery as hell. If I trotted AFL participation in all formats out in oh lets say NZ. and claimed there were tens of thousands of participants when there was just a fraction of that in actual players, Id be rightfully laughed out of these forums.


thats your opinion too mate.
the fact it fluctuates from allegedly 3000-15000 a game shows how flawed it is in its methodology. It’s literally 1 house or 5 houses watching, or one house with 4 of his mates one day and one house on his own the other. That’s how susceptible to variation it is with such a small sample group for 2million people.

It may be “the best they can do” but it’s still extremely iffy, especially when then extrapolating it up to a full population. Like I said how can you get 4000 viewers when one box = 3000 people. Was there 0.3 of a person watching somewhere? And why are the numbers always full numbers in the thousands, hmmmmm?

I agree, hence why my estimate that 40-50% of them are RL fans and the other half casual sports viewers.

the 30k is registered full contact players and players who’ve played touch footy for a club in WA. I’m not talking your Auskick bs numbers afl comes out with.

it is, but it’s at least based on my observations of being at all those games, Unlike yours which is just a guess to back up a predetermined unfounded opinion.
 
Last edited:
Messages
14,822
Nine Now data is publicly available every week, as well as consolidated in total tv data (averaging 32k per match) - its worth noting that this is not done via set top box, Oztam using a different methodology for it. We do get some limited reporting - generally early in season - on kayo numbers (which is where i and others use it to conservatively estimate it for the rest of the season).
We'll see shifting TV viewing patterns over the next 10 to 20 years. The older generation doesn't really embrace the new technology and an increasing amount of young people don't have a TV.
 

The_Wookie

Bench
Messages
3,248
the fact it fluctuates from allegedly 3000-15000 a game shows how flawed it is in its methodology. It’s literally 1 house or 5 houses watching, or one house with 4 of his mates one day and one house on his own the other. That’s how susceptible to variation it is with such a small sample group for 2million people.

Its also susceptible to competing television programming - as demonstrated by the goddamned ratings for every other program in Perth.

It may be “the best they can do” but it’s still extremely iffy, especially when then extrapolating it up to a full population. Like I said how can you get 4000 viewers when one box = 3000 people. Was there 0.3 of a person watching somewhere? And why are the numbers always full numbers in the thousands, hmmmmm?

Because thats how Oztam choose to publish them. The raw data used to come to us slightly differently, but the average rating is always rounded up to the thousand for publishing.

I agree, hence why my estimate that 40-50% of them are RL fans and the other half casual sports viewers.

the 30k is registered full contact players and players who’ve played touch footy for a club in WA. I’m not talking your Auskick bs numbers afl comes out with.

Already showed the published - and previously linked - the 4100 actual registered league players.

Your point about Auskick might even be true except Touch Football Australia counts program and event participants, school delivered programs, and even f**king volunteers - its numbers could be even more f**king rubbery than anything the AFL produces for Auskick. Like who the f**k counts volunteers - except soccer.
1670766230582.png

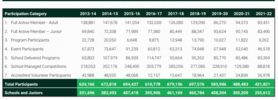
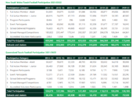
Your problem here is that the 2022 Touch Football Australia Annual Report is like available to be read by all and sundry.

This year the total number fof active adults in AUSTRALIA was 83,451 (64,895 in QLD/NSW alone) and 83,490 juniors (77,389 in QLD/NSW). This leaves 18,556 registered adults and 6,101 juniors for the entire country outside of NSW and QLD. That almost certainly means that these 24,000 folks arent all in WA.
1670766259933.png


it is, but it’s at least based on my observations of being at all those games, Unlike yours which is just a guess to back up a predetermined unfounded opinion.

Mine is backed up with decades of data and annual reporting from industry bodies and sporting codes. Your source appears to be your posterior. Yours appears to be based on a "well it cant be true, I dont want it to be" philosophy
 
Last edited:

Perth Red

Post Whore
Messages
69,549
Mine is backed up with decades of data and annual reporting from industry bodies and sporting codes. Your source appears to be your posterior. Yours appears to be based on a "well it cant be true, I dont want it to be" philosophy
you’ve got evidence that most of the crowd at nrl, origin and international games are not RL fans? Please do share!
 

DIOGENES

Juniors
Messages
1,683
Participation numbers are rubbery as hell. If I trotted AFL participation in all formats out in oh lets say NZ. and claimed there were tens of thousands of participants when there was just a fraction of that in actual players, Id be rightfully laughed out of these forums.

15 years ago there were only 600 AFL players in NZ but after the spectacular success of the Kiwikick program in NZ schools by 2016 there were 35,000 registered players. It must be over 50,000 by now


(The really odd thing, no doubt due to the anti-afl bias of the NZ media, is that a google search for “Kiwi Kick” mainly returns results about a cocktail containing rum, midori and a kiwifruit)
 

Latest posts

Top