the phantom menace
Coach
- Messages
- 15,364
Its a trap @Poupou Escobar. George Michelyrulz will be there waiting...

| Merkins | Line breaks | Tackle breaks | LB per TB |
|---|---|---|---|
| Souths | 136 | 741 | 0.184 |
| Parramatta | 129 | 730 | 0.177 |
| New Zealand | 134 | 791 | 0.169 |
| Manly | 127 | 760 | 0.167 |
| Redcliffe | 124 | 743 | 0.167 |
| Cronulla | 142 | 870 | 0.163 |
| North QLD | 122 | 790 | 0.154 |
| Melbourne | 124 | 835 | 0.149 |
| Easts | 118 | 802 | 0.147 |
| Gold Coast | 124 | 846 | 0.147 |
| Brisbane | 139 | 958 | 0.145 |
| Newcastle | 142 | 1042 | 0.136 |
| Canterbury | 97 | 719 | 0.135 |
| Canberra | 99 | 748 | 0.132 |
| St George | 104 | 786 | 0.132 |
| Penrith | 129 | 1042 | 0.124 |
| Wests | 99 | 808 | 0.123 |
Given the minor premiers are second last, and five of the highest 8 on the list didn't make the Top 8, then Line Breaks per Tackle Breaks is no indicator or any kind of success?Got a pretty sweet statistic for youse:
Merkins Line breaks Tackle breaks LB per TB Souths 136 741 0.184 Parramatta 129 730 0.177 New Zealand 134 791 0.169 Manly 127 760 0.167 Redcliffe 124 743 0.167 Cronulla 142 870 0.163 North QLD 122 790 0.154 Melbourne 124 835 0.149 Easts 118 802 0.147 Gold Coast 124 846 0.147 Brisbane 139 958 0.145 Newcastle 142 1042 0.136 Canterbury 97 719 0.135 Canberra 99 748 0.132 St George 104 786 0.132 Penrith 129 1042 0.124 Wests 99 808 0.123

 www.rugbyleagueeyetest.com
Wins are the only indicator of success. But that requires zero analysis and tells us nothing about what's going on under the hood (bonnet). Things like tackle breaks and line breaks are indicators of attacking talent and teamwork. They break down some of the reasons for success, at least in attack. Obviously they say nothing about defence, which needs to be investigated with different statistical categories.Given the minor premiers are second last, and five of the highest 8 on the list didn't make the Top 8, then Line Breaks per Tackle Breaks is no indicator or any kind of success?
But it is fair to say that just because you have a good Line Break to Tackle Break ratio, it does not mean that you are more likely to win matches? Given the position of Penrith on the table provided I would say that it is no indicator at all of the chances of winning a game.Wins are the only indicator of success. But that requires zero analysis and tells us nothing about what's going on under the hood (bonnet). Things like tackle breaks and line breaks are indicators of attacking talent and teamwork. They break down some of the reasons for success, at least in attack. Obviously they say nothing about defence, which needs to be investigated with different statistical categories.
It would be fairly trite to just say wins are all that matter, but if that was the case clubs wouldn't waste so much money on statistical analysis. Anyone can just look at the win/loss table. It's not very insightful.
I personally think tackle breaks is an indicator of playing talent. Converting tackle breaks to line breaks might (or might not) say something about doing the best with the talent a team has.
I haven't got a clue what that merkin is talking about. He is a troll and also circular logic.OK I need a TLDR from @Poupou Escobar on this one.

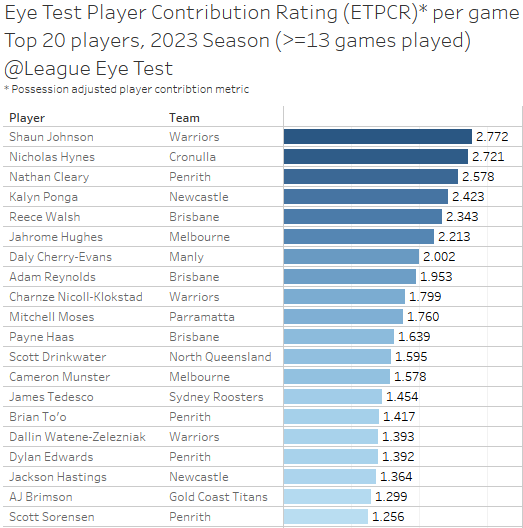
The Eye Test's advanced statistic leaders for NRL season 2023 - The Rugby League Eye Test
The long 27 round slog that was the NRL 2023 season has finally concluded, which means we can take a look at which players topped the charts for the Eye Test’s suite of advanced statistics. If you’re a recent visitor to the Eye Test, I would recommend checking out the explainers on of them to...www.rugbyleagueeyetest.com
Whilst it's positive that we convert tackle breaks to full line breaks, the biggest issue in that stat is the fact we made the second least amount of tackle breaks in comp (only Bulldogs were worse) which shows a complete lack of power and explosiveness by our back 5 which typically are the dominant tackle breakers in a team. If we have the skill to convert tackle breaks to line breaks, then we need to create a gameplan that harnesses that and increases tackle breaks.I personally think tackle breaks is an indicator of playing talent. Converting tackle breaks to line breaks might (or might not) say something about doing the best with the talent a team has. It might also just indicate a different type of playing talent.
Well for starters this doesn't even look at defence. Does that mean no statistic matters unless it looks at both attack and defence? You are missing the point of analysis if you believe you can't break a problem down because it loses sight of the big picture. It is focusing on the big picture that limits our understanding of cause and effect.But it is fair to say that just because you have a good Line Break to Tackle Break ratio, it does not mean that you are more likely to win matches? Given the position of Penrith on the table provided I would say that it is no indicator at all of the chances of winning a game.
The statistics that show whether you're likely to win or lose a game as a result of that statistic are more relevant than ones that don't really have much correlation to whether you're more likely or not to win or lose a game.
I don't think it would be hard to work that out. But for the record, we are sixth for tries and equal sixth for line breaks.I'd be keen to see our Line Break to Try ratio and see where that sits.
Wins are the only indicator of success.
Yes, converting tackle breaks into line breaks clearly means sweet f**k all in the scheme of things.Given the minor premiers are second last, and five of the highest 8 on the list didn't make the Top 8, then Line Breaks per Tackle Breaks is no indicator or any kind of success?
All I took away from it was that one graph seems to indicate Reed Mahoney has the sixth best (worst) "negative contribution rating"OK I need a TLDR from @Poupou Escobar on this one.

The Eye Test's advanced statistic leaders for NRL season 2023 - The Rugby League Eye Test
The long 27 round slog that was the NRL 2023 season has finally concluded, which means we can take a look at which players topped the charts for the Eye Test’s suite of advanced statistics. If you’re a recent visitor to the Eye Test, I would recommend checking out the explainers on of them to...www.rugbyleagueeyetest.com


Misrepresent me and you’re getting blocked, merkinlast year you said it was points difference

What the f**k does this even mean, FFS?!!?Got a pretty sweet statistic for youse:
Merkins Line breaks Tackle breaks LB per TB Souths 136 741 0.184 Parramatta 129 730 0.177 New Zealand 134 791 0.169 Manly 127 760 0.167 Redcliffe 124 743 0.167 Cronulla 142 870 0.163 North QLD 122 790 0.154 Melbourne 124 835 0.149 Easts 118 802 0.147 Gold Coast 124 846 0.147 Brisbane 139 958 0.145 Newcastle 142 1042 0.136 Canterbury 97 719 0.135 Canberra 99 748 0.132 St George 104 786 0.132 Penrith 129 1042 0.124 Wests 99 808 0.123
I’m here to give you the right questions, not the right answers. Each man needs to decide those for himself, like the Mona Lisa.What the f**k does this even mean, FFS?!!?

FFS.I’m here to give you the right questions, not the right answers. Each man needs to decide those for himself, like the Mona Lisa.
